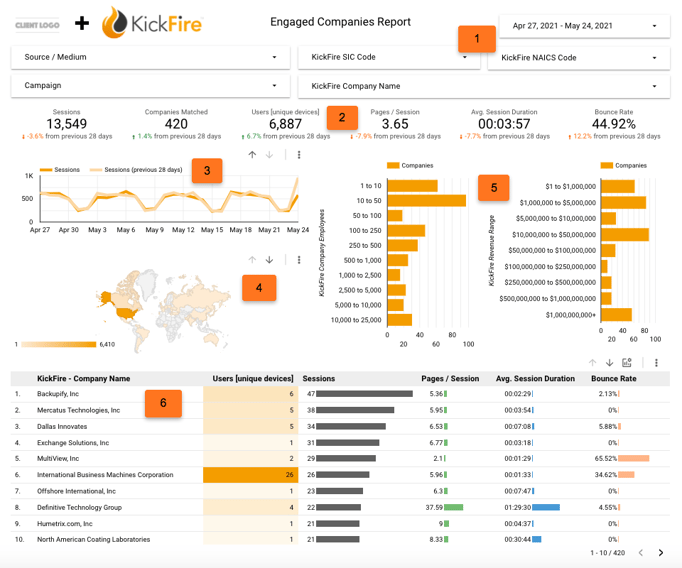
Utilize our standard Google Data Studio report to see your KickFire Custom Dimensions in an interactive dashboard that gives you the ability to:
- Filter by date range, Google Analytic parameters (Source/Medium, Campaign), and KickFire Custom Dimensions, and other customizable parameters.
- See analytics data, such as: Sessions and Companies Matched.
- Compare Sessions by date range.
- Drill down to headquarter locations of your visiting companies.
- Filter visiting companies by employee count and revenue range.
- See the companies that have visited your website and filter by Sessions, industry (NAICS/SIC), and more.
To activate your Google Data Studio report, please contact our Customer Success & Support team.